Recently, we had a PhD student in computer science come in with an intriguing problem. Jerrid needed a way to computationally track a mobile sensor embedded in a vehicle. The intrigue comes in the fact that what we know are the starting coordinates, and the ending coordinates of the sensor’s journey. What happens in between is not available to us as spatial coordinates (apparently some bad guys will jam the frequencies to destroy the GPS data), instead, only data on heading and speed are. Jerrid plans to compute the spatial coordinates from these input parameters.
Part 1: Creating a buffer web service
Assuming we do get the coordinates, Jerrid now needs to be able to compute a buffer around the sensor’s journey path. Our team decided to provide this as a web service that does the following:
- feed it a bunch of coordinates
- draw a line from the coordinates
- draw a buffer around the line
- provide the data back in JSON format
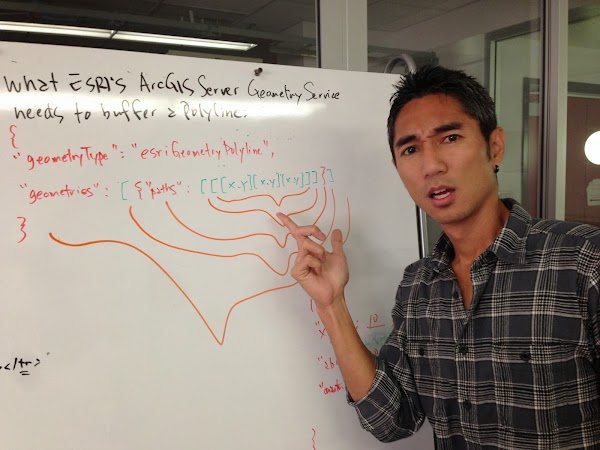
We chose to use ArcGIS Server’s Geometry Service’s REST endpoint to accomplish this. As most things with ESRI’s daunting ArcGIS enterprise, finding the right parameters to accomplish this was no easy task. While ArcGIS Server comes with a “buffer” web service, the documentation provided to buffer points is provided, but lines are not. Creating the correct structure to feed the REST endpoint was, well, a challenge to be polite…
For those of you javascript inclined folks, you need to…
feed it an array of xy coordinates as a bunch of arrays inside another array inside yet another array inside an object inside another array all wrapped up inside a final object.
beffudled…
Here is the javascript code that begins to generate the JSON buffer polygon. First, the onclick event on the map itself that allows the dynamic creation of buffer nodes:
google.maps.event.addListener(map, 'click', function(event) {
	// add a marker
	addMarker(event.latLng);

	// if it is a point
	if($('#geomtype').val() == "esriGeometryPoint")
	{
		buffergeometry = {"x" : event.latLng.lng(), "y" : event.latLng.lat()};
	}
	//if it is a line
	else
	{
		//each lat/lng as an array
		buffergeometry = [event.latLng.lng(), event.latLng.lat()];
	}
	// each lat/lng array inside another array
	geometries.push(buffergeometry);
});
Finally, when you draw the buffer, the geomtries need to be adjusted so that ArcGIS Server can read them:
//if it is a polyline buffer, put the geometry in an array inside an object inside an array
if($('#geomtype').val() == "esriGeometryPolyline")
{
	geometries = [{"paths":[geometries]}];
}

//put the geometry inside another object that defines the ESRI geometryType
buffernodes = {"geometryType":$('#geomtype').val(),"geometries":geometries};
Here is an example output of buffers around points:

And an example of a buffer around points representing a line:

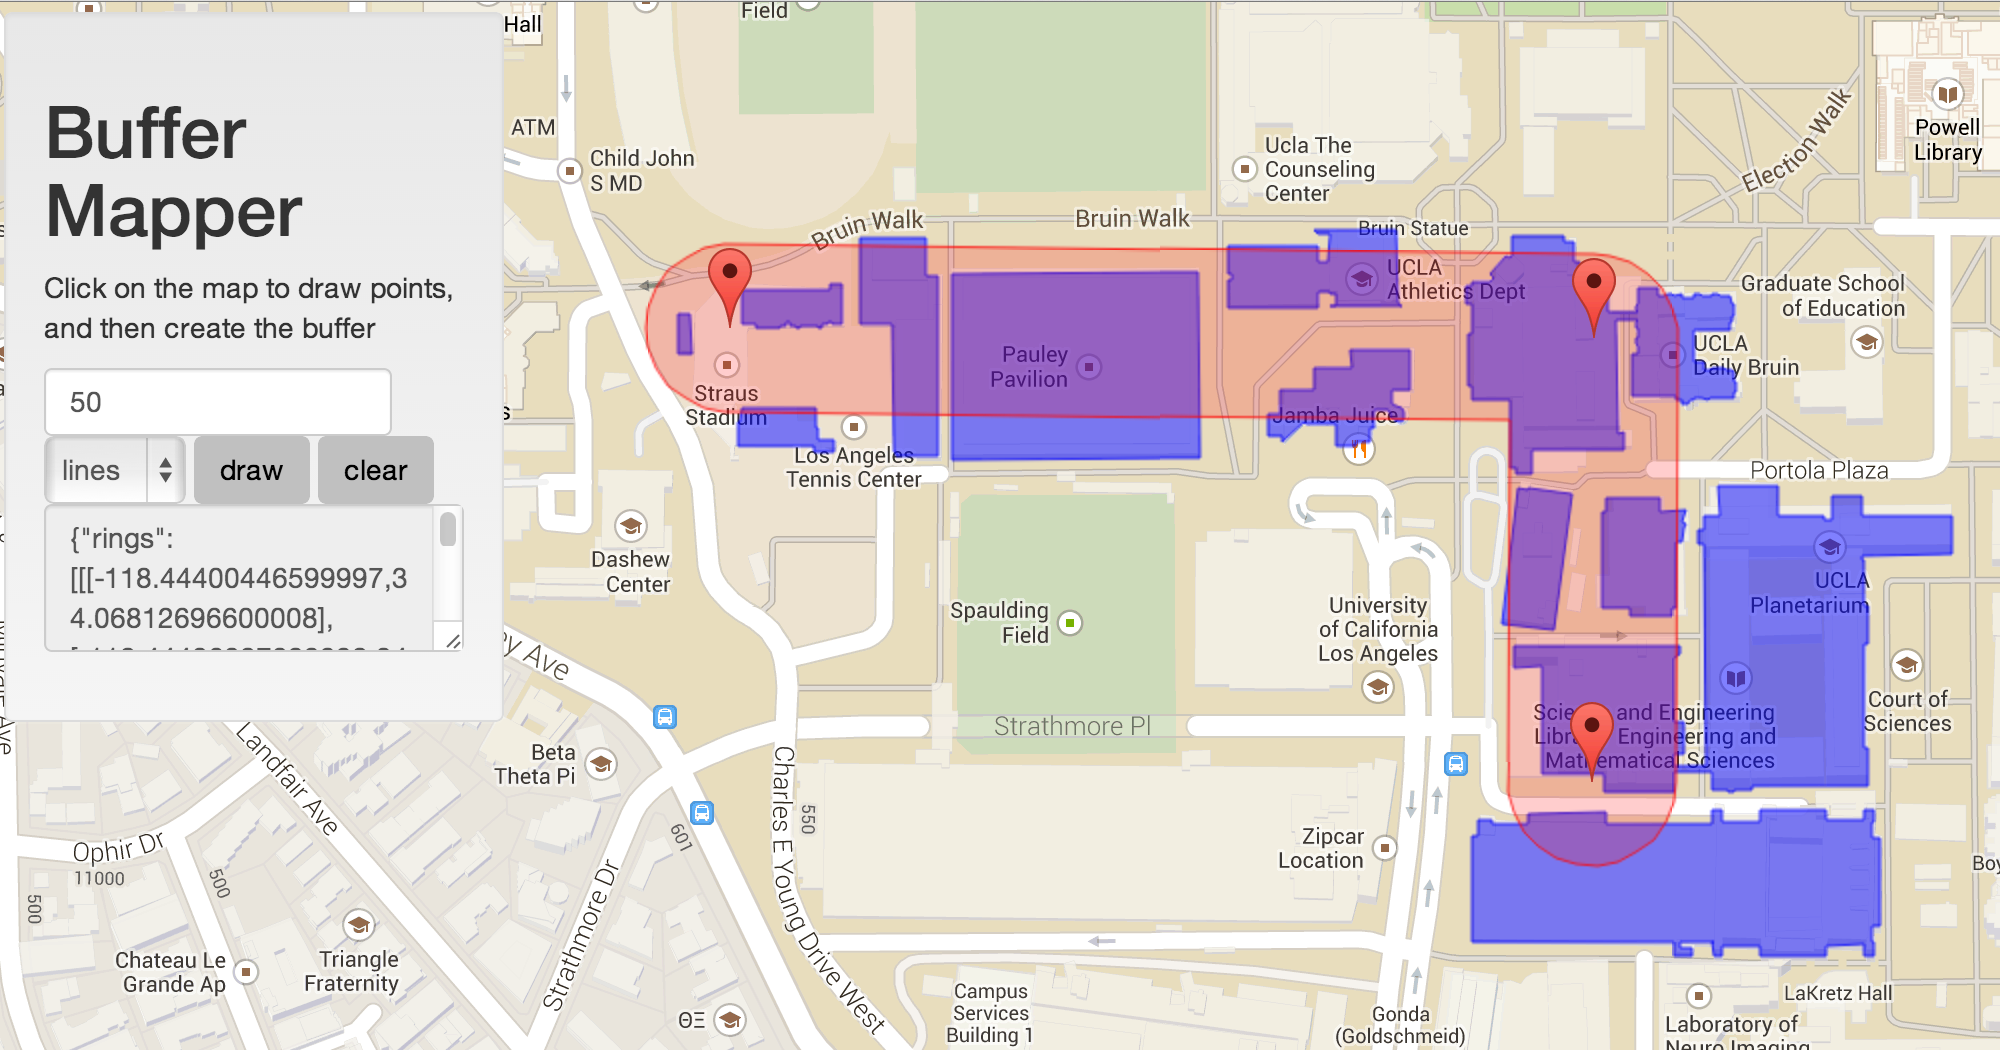
Part 2: Using the buffer to find polygons that intersect it
Now that we have the buffer in a nice JSON format, the next task is to see if the JSONPolygon can be used to find other polygons (in this case buildings). To do this, another web service needs to be generated. This web service will take in the JSONPolygon, and perform a spatial query on a building layer, retrieving only those buildings that intersect with the buffer.
The first attempt was to do this with the trusted jQuery calls: $.getJSON and $.each . However, the buffer JSONPolygon is an extremely long string… easily exceeding 2000 characters, which is the limit of what you can feed a URL based AJAX call. To circumvent this limitations, we are forced to use the ESRI Javascript API and their library calls to make the query work. It turns out that doing it this way makes it leaps and bounds easier to make spatial queries to an ArcGIS Server, making me question my own tendencies of mixing map services…
To conduct the spatial query (buffer to polygon), the following javascript code was used:
function getBuildings()
{

	// map service with the building layer
	queryTask = new esri.tasks.QueryTask("http://pumi.ats.ucla.edu/arcgis/rest/services/jerrid/ucla_buildings/MapServer/0");

	//initialize query
	query = new esri.tasks.Query();
	query.returnGeometry = true;
	query.geometryType='esriGeometryPolygon'
	query.inSR='4326'
	query.spatialRel='esriSpatialRelIntersects'
	query.returnGeometry=true
	query.outSR=4326

	//convert the buffer JSON string to an esri geometry polygon
	var polygonJSON = rings;
	var polygon = new esri.geometry.Polygon(polygonJSON);
	query.geometry = polygon;

	// execture the query and draw polygons for the buildings it returns
	queryTask.execute(query,function(data){
		$.each(data.features,function(i,val){
			var buffercoords = [];
			$.each(val.geometry.rings[0],function(i,val){
				var markerLatLng = new google.maps.LatLng(val[1],val[0]);
			 	buffercoords.push(markerLatLng);
			})

			var bufferpoly = new google.maps.Polygon({
				paths: buffercoords,
				strokeColor: '#0000FF',
				strokeOpacity: 0.8,
				strokeWeight: 1,
				fillColor: '#0000FF',
				fillOpacity: 0.5
			});
			bufferpoly.setMap(map);
			bufferpolys.push(bufferpoly);
		})
	});
}
Now, when you generate a buffer, it actually draws the polygons that it intersects with (buffer in red, polygons in blue):
