Mercator has been around for almost 500 years, but interestingly, it has almost single-handedly dominated the interactive mapping interfaces on the web, largely due to the adoption by the “big” players, Google, ESRI and Open Layers to name a few. Therefore, the “World” looks geometrically identical on all maps produced by these open API’s:

ESRI


open layers
While the Mercator projection serves an honorable medium for consistency and interoperability, especially at local levels where its inherent distortions are all but invisible, it has succeeded grandly on one front: it has made web maps devoid of alternative and imaginative experiences on viewing spatial data.
To this front, several alternatives have cropped up in recent years to challenge the Mercator domination of the web. One in particular, D3 Geo, allows new forms of visualizing spatial data that have not been possible using any of these dominant players, and I would like to delve into the possibilities for alternative mapping visualizations for spatial data here.
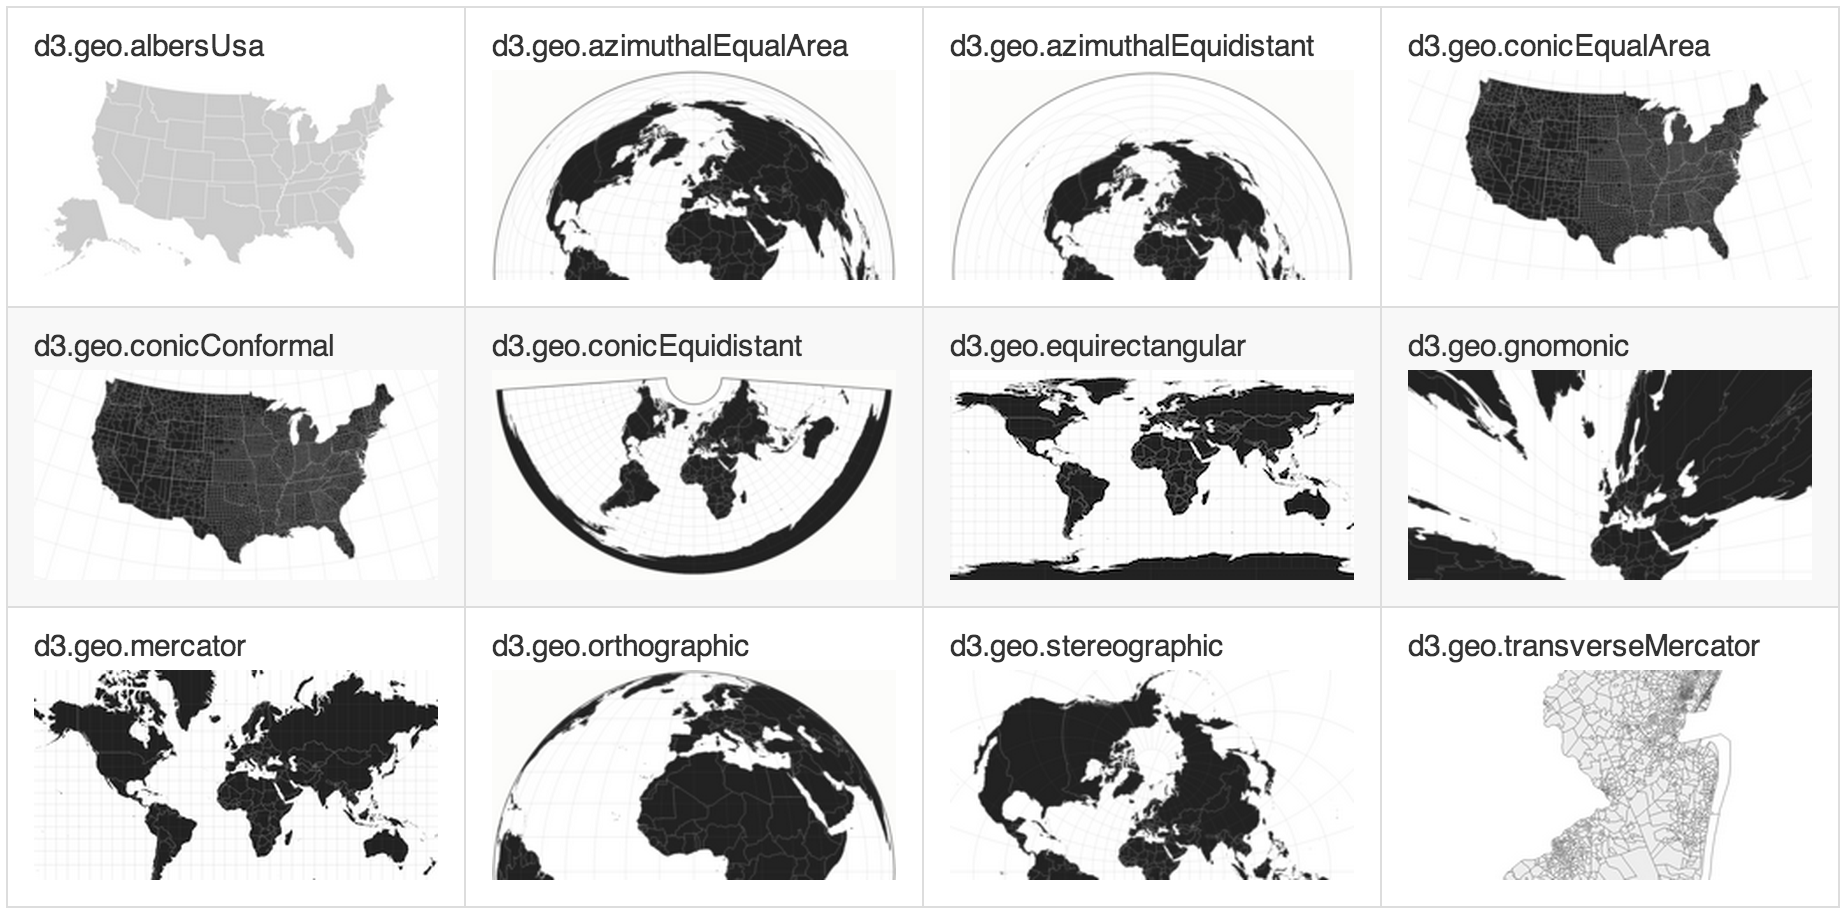
For starters, D3 provides users with a plethora of projection choices to start with. Here are a few examples:

Furthermore, the javascript framework largely revolves around the concept of movement: animation is a built in structure that allows for malleable mapping components. In his thoughtful and eye-opening discourse on the intricacies of map projections, Mike Bostock (author the D3 library), demonstrates in dazzling fashion, visual transitions between different projections.
Cartograms
Projections aside, what about visualizing spatial data? Once again, D3 provides us with alternatives from the typical choropleth and bubble maps that have become way too abundant on the web… One idea that I would like to discuss is the notion of cartograms. A 2008 New York Times article on the value of an American vote shows a non-contiguous cartogram in a highly effective manner:

This interactive cartogram shows population density in Japan:
There are several implementations of Cartograms using D3.
