After much deliberation, we have made the decision to forge ahead with ArcGIS Server as the hosting platform of choice for the UCLA Digital Libraries Map Collections. Ultimately, the decision came down to ArcGIS because of its interoperable nature, plus the fact that the University has a Site License Agreement with ESRI that makes using this technology affordable. However, this choice was not without its many bumps along the way, one of which was the difficult decision to use a non-open source technology. One of the other drawbacks of using ArcGIS Server has been its inability to generate high quality imagery of the georeferenced, raster maps at higher (zoomed out) zoom levels. The built in image sampling methods provided by the ArcGIS application has always resulted in low quality imagery, something we have documented at length over the years (see here and here).
Creating the map viewer
Once the choice to use ArcGIS Server was made, the next challenge was to create the front end map viewer. Ease of use was the primary focus, and we decided to focus on two functionalities that would greatly enhance the user experience when viewing historical maps.
A Transparency Slider
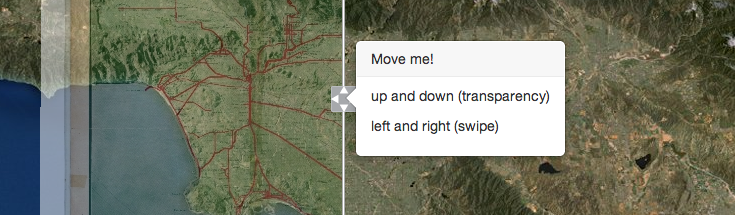
In order to minimize the clutter of tools and sliders, we decided to think of a way to use a single slider to achieve both functions mentioned above. The solution for this was to position a handle in the middle of page, and allow it to be dragged in all directions of the page. Moving the handle up and down changes the transparency, while moving the handle left and right moves the swipe tool.

The Map Viewer API
While not exactly an “API” in the traditional sense, our map viewer is entirely configurable through URL parameters. Here are a list of accepted parameters:
[table “” not found /]The map viewer is capable of taking in any Map Service hosted on any ArcGIS Server, as long as the service is public. For example, we can bring in LA County’s LARIAC satellite imagery, zoom into UCLA, and see how it compares with ESRI’s own satellite imagery (LARIAC is on the left, ESRI on the right):