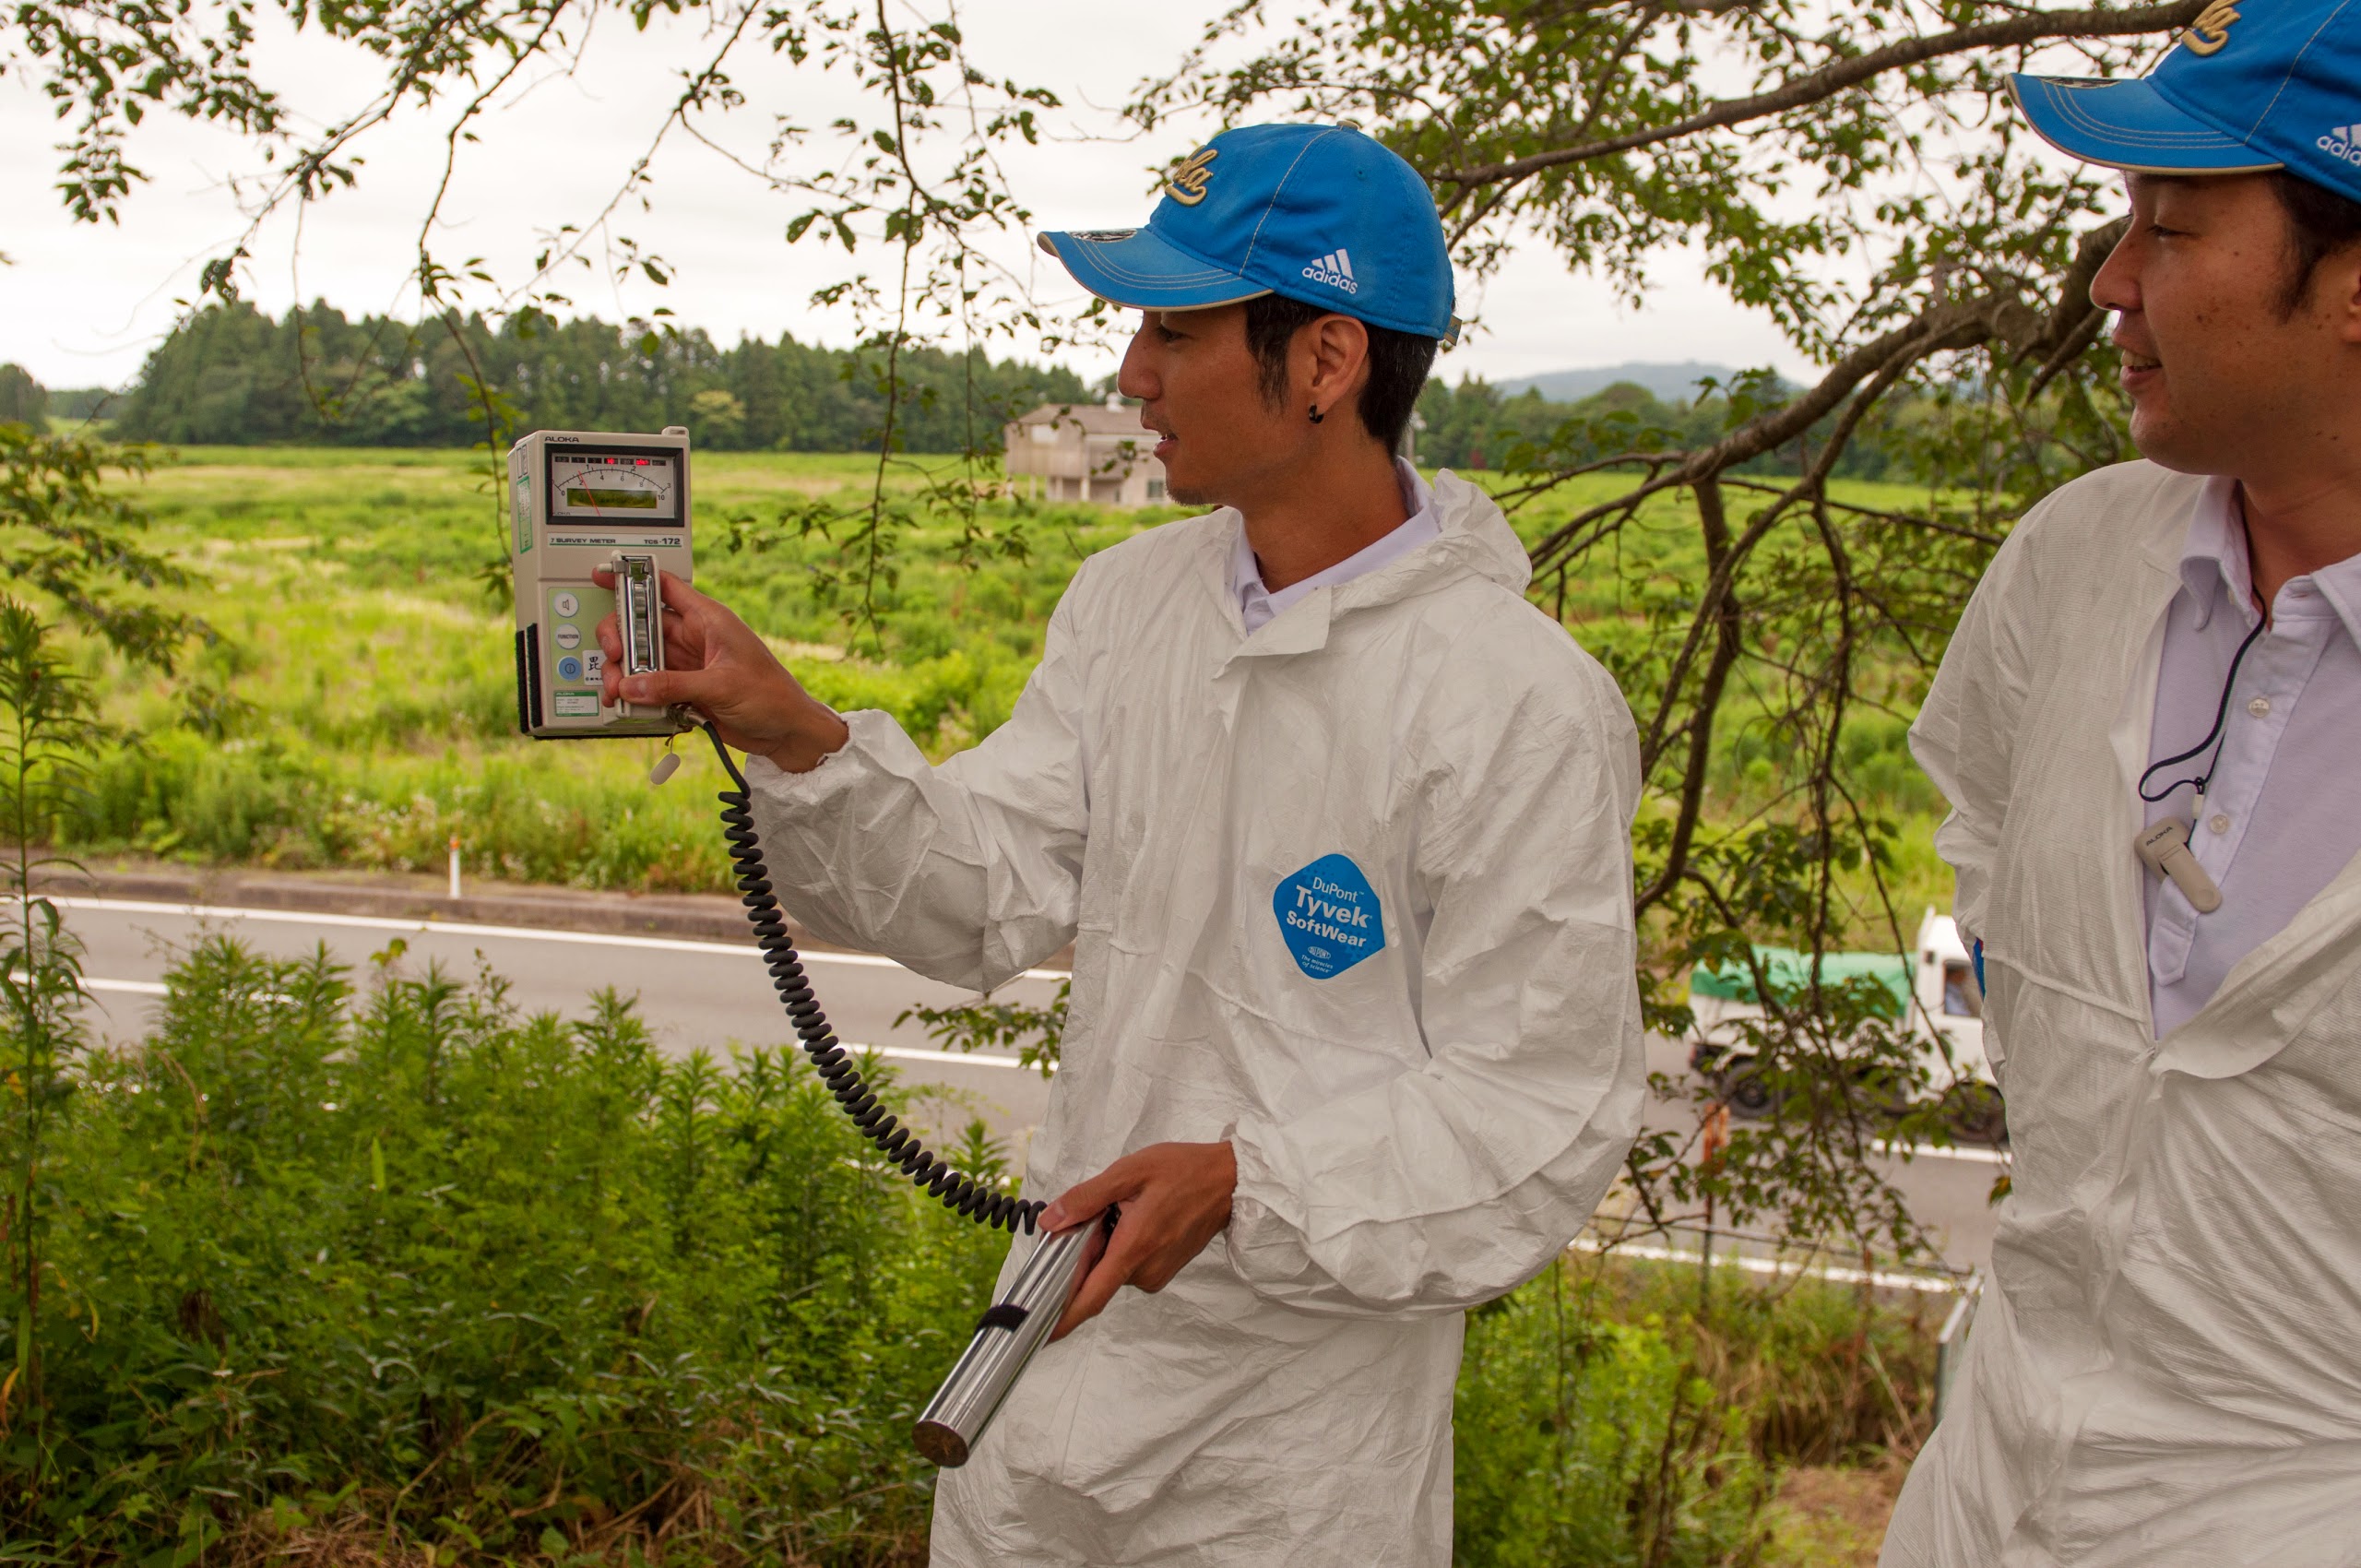
I am scheduled to present the Bishamon project at Cal Poly next week. As part of their “Science Cafe” presentation series, I have been asked to include an interactive, participatory element to engage and entertain the audience. The challenge is difficult. How do I entertain the audience on a topic that is all but “entertaining”? After much deliberation, I have decided to put together a scenario that mimics the nuclear disaster in Fukushima, but happening right here in California. The situation then becomes a local one, and the audience members are entrusted to be the ones to monitor and publish the levels of radiations to the public. But the question lingered… how would they publish radiation measurements on to a publicly accessible map… while being seated during a presentation? The answer? Twitter!
The Grid
Obviously, letting the audience loose to roam around the mountains of San Luis Obispo was not an option… so I decided to go with a pre defined “grid” map of the area.


