


The Equipment
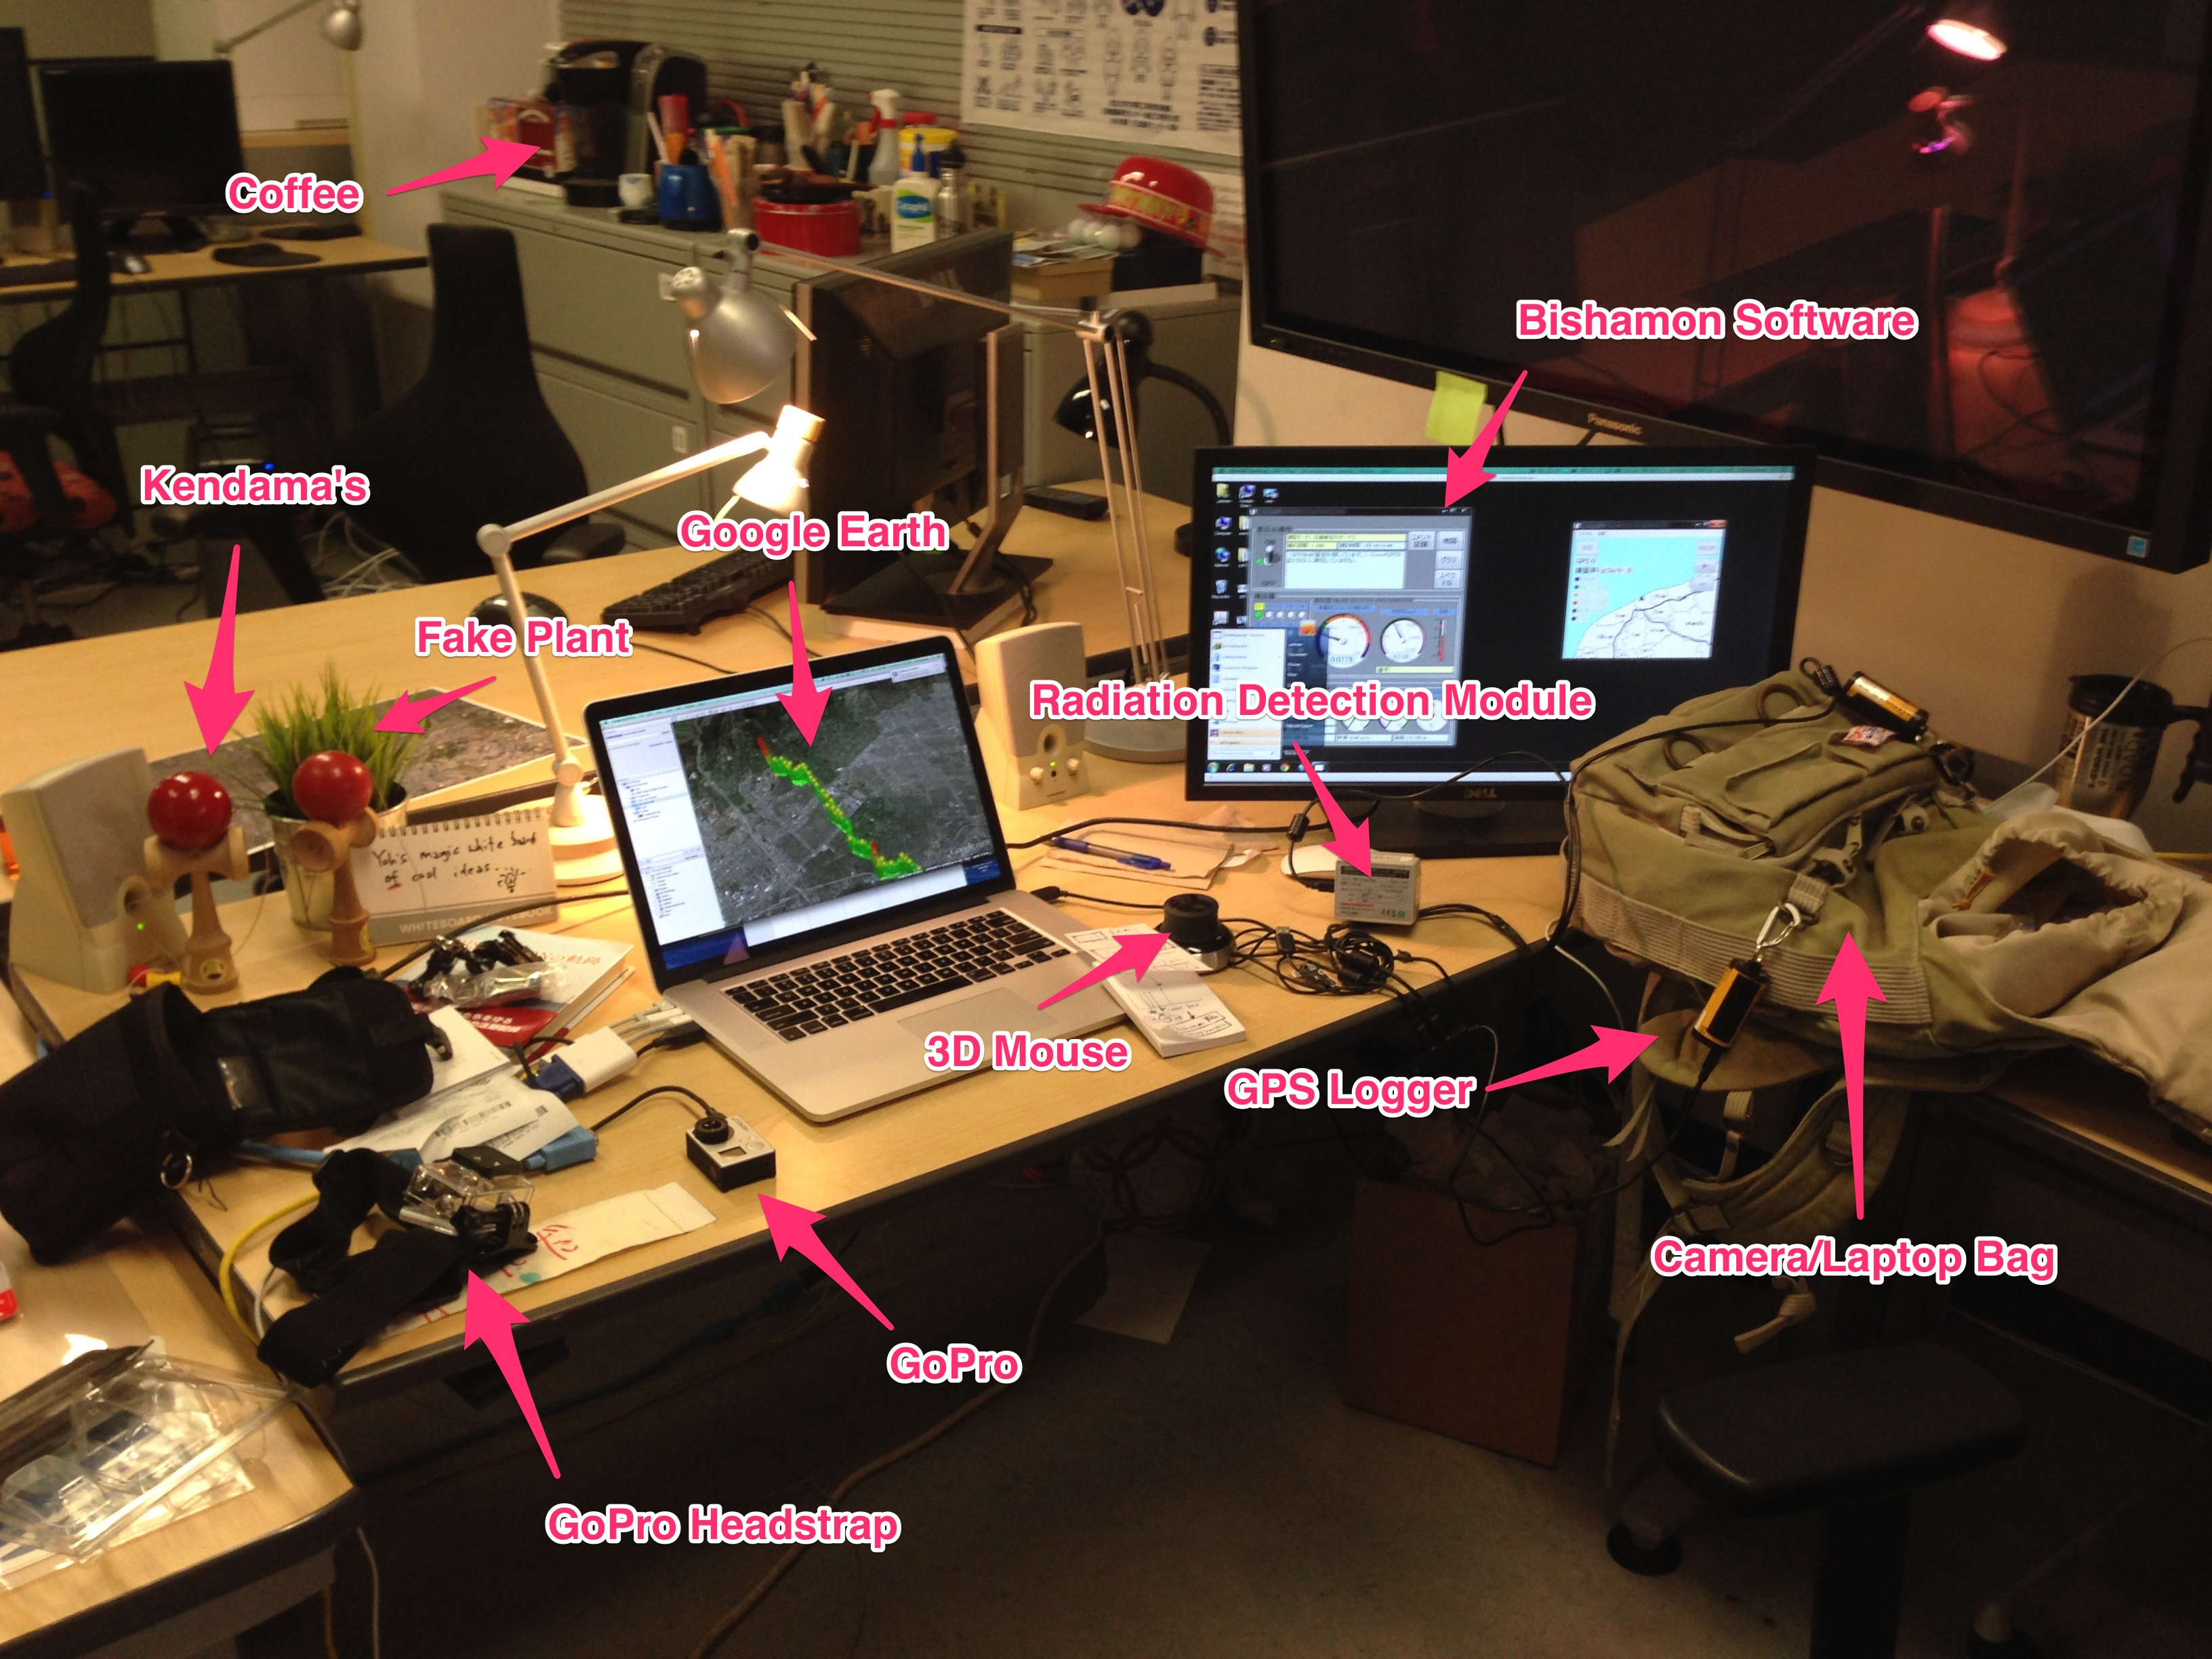
In preparation for my talk on measuring radiation in Cal Poly, I decided to actually measure radiation along the route between Los Angeles and San Luis Obispo. My great colleagues from Niigata University agreed to support my whimsical needs, and carefully packaged and shipped the Bishamon radiation monitoring equipment my way. The package, as you can see from the pictures above, included:
- a radiation detection module (Hamamatsu C12137-01)
- 2 GPS loggers (Holux M-241)
- DVD’s with the Bishamon radiation monitoring software (DoseMapping 5.1.1)
- stickers with the Bishamon and UCLA logo’s
- a T-shirt!
Running Bishamon required the installation of the necessary drivers for each device, and the installation of the DoseMapping software created by Jun Goto from Niigata University. Then, the devices need to be hooked up via USB to your laptop before running the application. The application is smart enough to detect whether or not the GPS and the Radiation Detectors are connected and running properly.

Dose Mapping Software
When everything is hooked up correctly, the application launches to reveal the following user interface:

By default, DoseMapper reads radiation every second, and correlates the reading with a timestamp and a location. When one is mobile with the application running, whether on foot or on a vehicle, it continuously monitors radiation in real time, producing the associated maps and graphs through its interface. The data is written onto a csv file for later consumption and visualization purposes.
Analysis
Having this setup configured, I took the device onto my family mini-van, and turned it on during our 4 hour drive up the coast of California, from Los Angeles to San Luis Obispo. The following map illustrates the results of the survey:

Each radiation reading is represented by a single
All in all, 19,197 survey points were collected. Here are some statistics:
| Count | 19197 |
| Minimum Dose Rate (μSv/hour) | 0.008297 |
| Maximum Dose Rate (μSv/hour) | 0.195111 |
| Mean | 0.059489 |
| Standard Deviation | 0.018924 |

Conclusion
The total distance traveled from Los Angeles to San Luis Obispo was just over 300km. On this route, the application logged a radiation readout every second (about every 15 meters), collecting almost 20,000 points. The average radiation was 0.059489 μSv/hour, and the highest recorded readout was 0.195111. In the absence of internationally defined safety standards in terms of radiation exposures, in Japan, it has been generally accepted that locations with consistent readings of radiation levels above 0.23 μSv/hour are to be prioritized for decontamination, symbolizing one given threshold of what is safe, vs what is unsafe. Based on the collected readings, we can confirm that there were no readings that fall within any known “unsafe” thresholds.
Sources
http://radiationsurvival.blogspot.com/
http://en.wikipedia.org/wiki/Sievert
http://www.epa.gov/radiation/understand/perspective.html